
The country that invented systematic household surveys in the 1950s has never conducted a national income distribution survey. The consumption data that substitutes for one produces a Gini coefficient of 25.5 — low enough for the government to claim India is the fourth most equal country in the world. The World Inequality Lab estimates the actual income Gini at above 0.60. The gap between those two numbers is not a measurement error. It is a political architecture.
In 2021, when I was part of the team working on the Oxfam India Inequality Report, one of the first things we had to reckon with was the absence at the centre of the exercise. We were trying to measure income inequality in a country with no official income distribution data. We had consumption surveys, asset surveys, tax return tabulations, Forbes lists, and national accounts aggregates. We did not have what Brazil has had since 1967, what Mexico has had since 1984, what the European Union collects annually from 27 member states: a nationally representative survey of what households actually earn.
We built estimates from triangulation. So did the World Inequality Lab in their landmark 2024 paper. So does the World Bank, whose Poverty and Inequality Platform for India carries explicit caveats about comparability, reliability, and the structural limitations of using consumption as a proxy for income. What none of us could do was report a number that the Indian government had itself collected and verified.
India is, by most measures, one of the most sophisticated statistical systems in the developing world. The National Sample Survey was established in 1950, among the first such national sampling institutions anywhere. India has population censuses dating to 1881, unbroken except for the current hiatus that has now lasted five years. It has detailed enterprise surveys, agricultural census data, periodic labour force surveys, and a household consumption survey with a methodological history stretching back seven decades.
It has never measured income distribution. Not once.
This article is about why that is, who it serves, and what the data we do have shows, actually, once you look carefully at what it is designed to conceal.
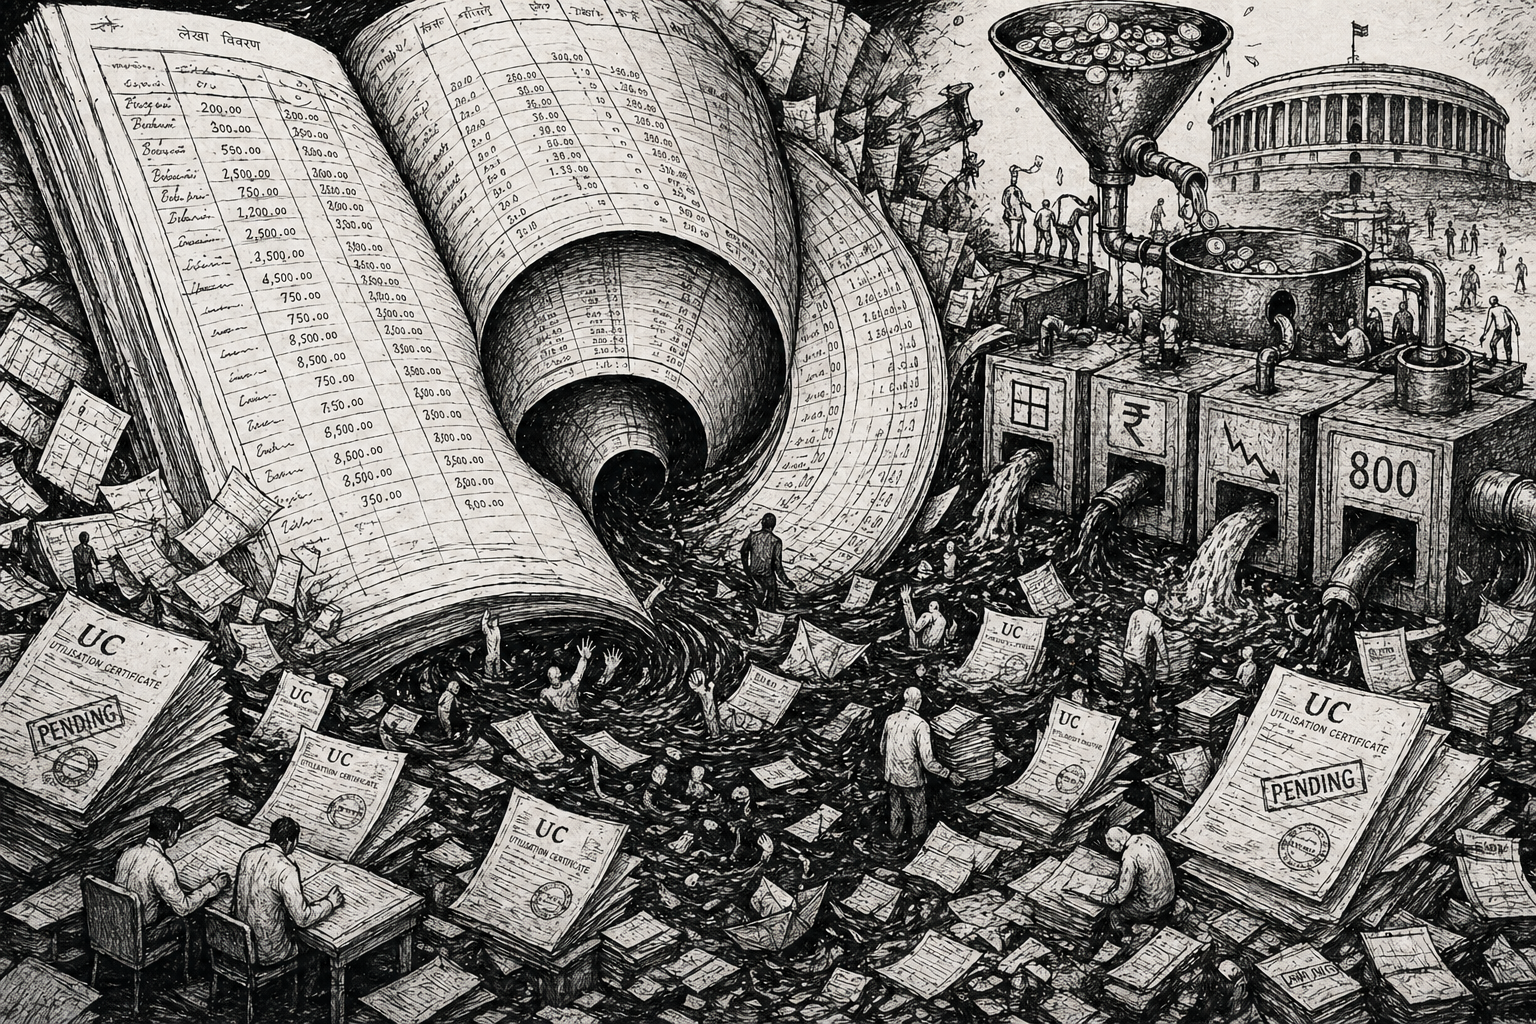
The proxy and its distortions
When economists want to measure inequality in India, they typically reach for the Household Consumption Expenditure Survey. The HCES asks households how much they spend, not how much they earn. It captures what families consume in food, fuel, clothing, education, and health over a reference period. It does not ask about wages, profits, agricultural revenue, rental income, dividends, capital gains, or savings.
The methodological case for using consumption as a proxy for welfare has genuine substance. In an economy where a large share of self-employed and agricultural workers receive irregular income in cash and kind, consumption is often more stable and more accurately recalled than income. Poor households smooth consumption by borrowing, so a single-week consumption figure may better reflect their longer-term living standard than a snapshot of income.
The problem is that consumption diverges from income most sharply at precisely the part of the distribution that matters most for inequality measurement: the top. The rich do not consume their income. They save it, invest it, and accumulate it as capital. India's gross domestic savings rate has historically been around 28 to 30 percent of GDP, but this aggregate disguises enormous distributional skew. The top decile saves a vastly disproportionate share while the bottom deciles run net deficits, borrowing to maintain consumption above income levels. Capital income — stock market gains, dividends, mutual fund returns, rental income on property — does not appear in consumption surveys at all. The BSE SENSEX grew 7,300 percent between 1990 and 2023. India's billionaire count rose from one in 1991 to 162 in 2022. Household investments in equities and mutual funds nearly doubled from ₹1.02 trillion in FY21 to ₹2.02 trillion in FY23. None of this registers in the HCES.
The India Human Development Survey, which uniquely collected both income and consumption data from the same households, allows researchers to directly compute the extent to which consumption understates income at each point in the distribution. The scaling factors — the ratio of income to consumption — increase monotonically up the distribution, meaning the higher you go, the more consumption undercounts actual economic position. At the very top, the undercount is not marginal. It is the difference between the households that appear to be doing reasonably well in the survey and the households that are accumulating most of the country's wealth.
The result: a consumption Gini of 25.5, which the government cited in 2025 to claim that India was the fourth-equal country in the world. The World Inequality Lab's income-based estimates place India's Gini above 0.60. The gap between those two figures is not measurement noise. It is a structural feature of what the data is designed to see and what it is designed to miss.
Seventy-five years of not asking
India has attempted to collect income data five times since independence. Experimental income questions were included in consumer expenditure surveys in the 1950s and in further trials in the 1960s and 1980s. All five attempts were abandoned. The stated reasons — methodological complexity, recall difficulties, non-response among wealthy households — are the same challenges that Brazil, Mexico, South Africa, and every OECD country have navigated in building their income survey systems.
The Canberra Group Handbook on Household Income Statistics, which India helped develop through its participation in the UN Expert Group, explicitly addresses self-employment income, seasonal agricultural earnings, in-kind payments, and irregular income as tractable methodological problems with established international solutions. Brazil began its PNAD precisely because policymakers needed income data to evaluate minimum-wage policy and track the effects of economic development on income distribution. Mexico began ENIGH for the same reasons. South Africa's Income and Expenditure Survey exists because apartheid's distributional legacy required explicit measurement for political address. In each case, the political will to understand the distribution preceded the survey infrastructure. In India, the political will has been consistently absent.
The C. Rangarajan Commission, which reviewed India's statistical system in 2000, recommended creating an autonomous National Commission on Statistics with statutory backing, accountable to Parliament rather than the executive. The National Statistical Commission was established by government resolution in June 2005, with a promise of statutory backing "within one year." As of 2026, the NSC still lacks statutory backing. The draft NSC Bill prepared in 2019 was never introduced in Parliament.
The 2026 Household Income Survey, which the government has described as "India's first-ever comprehensive Household Income Survey," will be the sixth attempt to fill this gap. There is reason to be cautious about whether it will succeed where five previous attempts failed, for reasons this article examines below.
Who benefits from not knowing
The absence of income data is not politically neutral. It insulates specific interests from scrutiny in ways that are straightforward to identify.
Agricultural income is entirely exempt from central income tax under Section 10(1) of the Income Tax Act, 1961. This exemption is widely understood to be used by wealthy individuals to route income through agricultural channels and avoid taxation. Per the ICE 360° survey, approximately five million "wealthy farmer" households earn over ₹25 lakh annually. Though constituting only 8 per cent of the farming population, they control 28 per cent of the sector income. Many state legislators and members of parliament are large landowners who benefit directly from the exemption. Without official income distribution data, the concentration of agricultural income cannot be officially quantified, and reform cannot be grounded in evidence that anyone is obligated to produce.
Every committee since the Indian Taxation Inquiry Committee of 1925 has recommended bringing large agricultural incomes into the tax net. None of those recommendations has been implemented. The Report of the Tax Reform Commission of Karnataka (2001) documented in detail how corporations were already routing non-agricultural income through agricultural channels to exploit the exemption, yet no action was taken. The structural invisibility of agricultural income distribution is not an accident of statistical design. It is a precondition for maintaining the exemption.
Capital income concentration tells a parallel story. The WIL's 2024 estimates find that the net wealth of Indian USD billionaires grew over 280 per cent between 2014 and 2022, ten times the growth rate of national income. The Periodic Labour Force Survey, India's main employment survey, does not capture capital incomes, which the WIL authors note "are likely to be crucial for the right tail of the distribution."
Income tax return statistics for 2018-19 show that 42 per cent of total incomes reported came from non-labour sources. Without official income distribution data, effective tax rates on the wealthy cannot be computed from public sources, and the distributional consequences of decisions like abolishing the wealth tax in 2015, reducing the corporate tax rate in 2019, or setting a flat 10 per cent long-term capital gains tax cannot be officially evaluated.
The welfare claim problem is equally pointed. The government has asserted it "doubled farmers' incomes" and "eliminated extreme poverty." Neither claim can be independently verified or refuted without income data. The distributional effects of MGNREGA, PM-KISAN, Jan Dhan Yojana, and the expanded PDS cannot be rigorously evaluated as Brazil evaluated Bolsa Família using PNAD data — where researchers could precisely attribute the fall in Brazil's Gini from approximately 0.60 in the early 2000s to 0.564 by 2004 to specific programs and policies. The absence of data is not merely an information gap. It is a shield against accountability that happens to be most useful to whoever governs.
The suppression pattern
The structural absence of income data is longstanding and predates the current government. What has changed since 2014 is the scale and systematic character of active data suppression when existing surveys produce politically inconvenient results.
The 75th Round Consumer Expenditure Survey was conducted from July 2017 to June 2018, the first consumption survey since 2011-12. In November 2019, Business Standard leaked its findings: inflation-adjusted average monthly per capita consumption had declined 3.7 per cent, the first such decline in over four decades. Rural MPCE fell 8.8 per cent. The survey period coincided with the aftermath of demonetization and the implementation of GST. On November 15, 2019, MoSPI announced it would not release the results, citing "data quality issues." This was the first time in independent India's history that a completed NSO survey was entirely suppressed. An internal expert panel convened to review the data did not recommend withholding it, as subsequently confirmed through RTI requests. Over 200 scholars, including Angus Deaton, Thomas Piketty, and Prabhat Patnaik, issued a joint statement calling this "an unprecedented attack" on India's statistical institutions.
The Periodic Labour Force Survey 2017-18 was completed and cleared for release by the NSC in December 2018. It was withheld. On 28 January 2019, acting NSC Chairman P.C. Mohanan and member J.V. Meenakshi resigned in protest, stating they were being "sidelined" and the commission was being "bypassed." Three days later, Business Standard published the leaked findings: unemployment at 6.1 per cent, a 45-year high. Minister of Petroleum and Natural Gas Dharmendra Pradhan declared there was "no such report." Mohanan responded that the NSC had approved it, and it was reflected in the minutes of their meeting. The data was released only after the 2019 elections concluded and the BJP had secured its second term.
The pattern continues. India's decennial census, conducted without interruption since 1881 — including during both World Wars — was postponed in 2021 due to COVID-19 and has not yet taken place. India is now in its fifth year without a census, while 143 of 233 countries conducted theirs after March 2020. The budget allocation for the census has been cut from ₹3,768 crore in 2021-22 to ₹1,309 crore in 2024-25. The director of the institute that conducts the National Family Health Survey was suspended in July 2023 after NFHS data contradicted government claims that India was open-defecation free and that Ujjwala had delivered clean cooking fuel to the majority of households.
The sequence matters. Consumption data showing a decline is suppressed. Employment data showing a crisis is suppressed. Agricultural income distribution is never collected. Capital income is never measured. Each individual decision can be explained away with technical objections. The cumulative direction is consistent: official India cannot see rising inequality, cannot confirm falling wages, and cannot verify welfare claims. This is what a statistical system looks like when it has been systematically shaped to confirm, rather than test, a political narrative.
What the World Inequality Lab can see that official India cannot
In the absence of official data, the most rigorous estimates of Indian income distribution come from the World Inequality Lab's March 2024 working paper — "Income and Wealth Inequality in India, 1922-2023: The Rise of the Billionaire Raj" — by Nitin Kumar Bharti, Lucas Chancel, Thomas Piketty, and Anmol Somanchi. Their methodology combines tax tabulations for the top 10 per cent of adults, consumption surveys for the bottom 90 per cent, national income accounts for aggregate control totals, IHDS consumption-to-income scaling ratios, AIDIS wealth surveys, and Forbes and Hurun rich lists to correct wealth distribution at the very top.
The findings are arresting. India's top 1 per cent income share reached 22.6 per cent in 2022-23, the highest level recorded since the series began in 1922, surpassing the peaks of the interwar colonial period. The top 10 per cent captured approximately 57.7 per cent of national income. The bottom 50 per cent received roughly 15 per cent of the national income. Wealth concentration is even more extreme: the top 1 per cent held 40.1 per cent of national wealth, up from 12.5 per cent in 1980. India's billionaire wealth as a share of national income grew from under 1 per cent in 1991 to 25 per cent in 2022.
The historical trajectory shows a U-shaped curve. Top income shares declined from around 21 per cent in the late 1930s to about 6 per cent in the early 1980s under policies of nationalisation, high progressive taxation, and market regulation. The reversal began in the mid-1980s, accelerated after the 1991 liberalisation, and has been particularly steep since 2014, especially in wealth concentration. The authors conclude that India's "Billionaire Raj" is "now more unequal than the British Raj headed by colonialist forces" — and they add an explicit caveat: "the quality of economic data in India is notably poor and has seen a decline recently. It is therefore likely that our results represent a lower bound to actual inequality levels."
That last sentence is worth sitting with. The most comprehensive attempt by outside researchers to quantify Indian inequality, using every available data source, including those the government itself does not publish, concludes that their findings probably understate the reality.
The AIDIS wealth survey reveals why. The maximum reported household wealth in the 2018 AIDIS was ₹3.28 crore. Forbes placed India's wealthiest individual that year at approximately ₹3.31 lakh crore — a gap of roughly 100,000 to 1. India's survey-based wealth distribution literally cannot see the top of the wealth pyramid. The data does not fail to measure the wealthy because they are hard to find. It fails because wealthy households refuse to participate in surveys at much higher rates, because their assets are distributed across entities and jurisdictions that household surveys cannot reach, and because no mechanism exists to compel or cross-check disclosure.
The HCES 2023-24 and the appearance of improvement
The HCES 2022-23 fact sheet was released on 24 February 2024, weeks before the announcement of the 2024 general election, and the HCES 2023-24 fact sheet followed on December 27, 2024. These were the first consumption data releases since 2011-12, ending the twelve-year gap created by the suppression of the 2017-18 survey. NITI Aayog CEO B.V.R. Subrahmanyam immediately declared that poverty had fallen below 5 per cent. The 2023-24 survey reported rural MPCE of ₹4,122 and urban MPCE of ₹6,996 per month. The consumption Gini was reported at 0.237 for rural India and 0.284 for urban — historically low figures.
But the methodological changes between the suppressed 2011-12 survey and the new series are so extensive that multiple scholars have concluded the data are not comparable. The recall period was changed entirely to the Modified Mixed Reference Period. Item coverage expanded from 347 to 405 items. Data collection shifted from single-visit pen-and-paper to three separate monthly visits using tablet-based CAPI. The sampling design has changed: rural samples now include villages that are physically closer to urban areas, which tend to be more affluent. Urban stratification shifted to car ownership value as a marker of household type. The 2011-12 survey mandated that 25 per cent of the urban sample come from the bottom three MPCE deciles; no equivalent quota exists in the new design.
These are not neutral technical improvements. Each choice pushes measured consumption upward. Longer, multiple-visit recall captures more consumption than a single-visit survey. Including imputed rent for owner-occupiers — a methodological addition in the new surveys — inflates measured household consumption for the approximately two-thirds of Indian households that own their homes, without adding a single rupee to their actual welfare. Expanding item coverage to include consumer durables introduces lump-sum purchases that are then distributed over the use period, again inflating the measured monthly figure.
Economist S. Subramanian's analysis of the 2022-23 growth incidence curve found that the richest decile in urban India appeared to experience consumption growth at only one-third the rate of the poorest decile — a degree of distributive improvement "hard to associate with the development experience of this country over the last decade." His conclusion: either the new survey is radically non-comparable with its predecessors, or the reliability of the survey itself is in question.
The gap between National Accounts Private Final Consumption Expenditure and HCES-measured consumption has widened from about 5 percent in 1972-73 to approximately 54 percent in 2023-24, according to analysis published in Economic and Political Weekly in 2026. The HCES now captures only about 46 percent of measured national consumption. The missing 54 percent — luxury goods, financial services, international travel, the consumption of the ultra-wealthy — accrues to the same households whose incomes the survey also cannot see. The top 5 percent urban MPCE in HCES 2023-24 was ₹20,310 per month, roughly ₹670 per day. This is, self-evidently, an underestimate of what India's wealthiest urban households consume. The survey is becoming less informative over time even as the economy grows more complex and unequal.
The 2026 income survey and the politics of it actually happening
The government's announcement of a Household Income Survey for 2026 is the most significant statistical commitment of the current period. It represents the first attempt since independence to collect comprehensive household income data across all sources — wages, self-employment, agriculture, capital income, transfers — using Canberra Group methodology.
There are grounds for cautious optimism. The survey's announced design incorporates international best practices: multiple income-source modules, separate agricultural income collection via crop accounts, and integration with administrative tax data for cross-validation at the top of the distribution. MoSPI has acknowledged that this will be "India's first-ever comprehensive Household Income Survey" — an admission that the structural gap exists.
There are also grounds for concern. Pilot testing has already revealed high refusal rates among affluent urban households, particularly for income-tax-related questions, replicating the problems that defeated earlier attempts. The political constituencies that benefit from the data vacuum — large landowners, capital income earners, businesses operating across formal and informal channels — have not changed. The NSC still lacks statutory independence. The 2026 Household Income Survey has not been backed by legislation, meaning a future government that dislikes the results will face no legal barrier to suppressing them — the same absence of statutory protection that allowed MoSPI to withhold the 2017-18 CES without any legal challenge.
The critical test will not be whether the survey is conducted. It will be whether the results are released, regardless of what they show. India has repeatedly demonstrated the technical capacity to collect data that it subsequently suppresses. Statistical credibility requires not just collection but publication, accessible unit-level data, and institutional protection of the release process from executive interference.
What would change if we actually knew
The stakes of this data vacuum are not abstract. They are the specific policies that cannot be evaluated, the claims that cannot be contested, and the redistribution that cannot happen because no one can officially demonstrate it is needed.
A rigorous income survey would enable the computation of effective tax rates across the income distribution, making visible whether progressive taxation is actually progressive in practice. It would allow evaluation of whether MGNREGA wage income reaches households below a credible poverty line, and whether PM-KISAN transfers are being captured by landowners who do not farm. It would make it possible to track whether economic growth is reducing or widening income gaps in specific states and sectors — the kind of sub-national distributional analysis that Brazil used to design targeted interventions. It would allow India to participate in the OECD Income Distribution Database and submit credible data to international comparative frameworks.
Less visibly but perhaps more importantly, it would create political accountability for distributive choices. Agricultural income taxation — currently a live debate in most public finance analyses but politically inert because no official data characterise the distribution of agricultural income — would become a debate with evidence to back it. The wealth tax, abolished in 2015, might be harder to abolish if the distribution of wealth were officially known. Capital gains tax rates would be set against the backdrop of who actually receives capital income, rather than on assumptions. The fiscal costs of tax exemptions to the wealthy could be quantified in distributional terms, not just aggregate revenue terms.
Brazil's experience is instructive here. The existence of continuous annual income data did not mechanically produce redistribution. It created the conditions under which redistribution became politically possible — because activists, opposition politicians, journalists, and policymakers could ground their arguments in official numbers that the government itself had produced and could not dispute. India's data vacuum does not make redistribution impossible. But it removes one of the most powerful tools for making redistribution politically legible.
What needs to happen now
The 2026 Household Income Survey needs to be backed by statute, not just an administrative decision. This requires amending the Collection of Statistics Act, 2008, to mandate a quinquennial household income survey as part of India's official statistical programme, to specify minimum coverage requirements, including all income sources, and to require the NSC to certify results before release. Without statutory backing, the survey's fate depends entirely on the political disposition of whatever government is in power when the results arrive.
The NSC's statutory independence is a precondition for any of this to matter. The draft NSC Bill needs to be introduced in Parliament with provisions modelled on comparable institutions in South Africa, Brazil, and the UK: a fixed-term Chief Statistician appointment requiring parliamentary confirmation, statutory authority to release survey results independently of ministry approval, and legal protection for staff who publish findings contrary to government preferences. The government's promise of this legislation in 2005 is now 20 years old.
The HCES methodological changes need transparent public accounting. MoSPI should publish, alongside every HCES release, a reconciliation table showing what share of the measured improvement in MPCE is attributable to expanded item coverage, recall period changes, sampling design changes, and imputed rent inclusion, versus actual improvement in household living standards. Without this breakdown, the survey cannot be used for time-series analysis, and comparisons with 2011-12 are meaningless. The World Bank has flagged these comparability concerns explicitly. MoSPI has not addressed them.
India should seek inclusion in the OECD Income Distribution Database as part of its Key Partner engagement. The prerequisite is a nationally representative household income survey meeting the IDD's Terms of Reference. Once the 2026 survey data is released, MoSPI should submit it to the OECD Secretariat for assessment. Formalising this relationship would create an external accountability mechanism: regular data submission commitments are harder to quietly abandon than domestic administrative decisions. This creates an external commitment mechanism: OECD membership in the IDD requires regular data updates, creating institutional pressure to continue the survey even when results are inconvenient.
Finally, the suppression of the 2017-18 CES and the PLFS 2017-18 needs to be officially acknowledged, and the data released. These surveys were completed, cleared by the NSC, and withheld for political reasons. The data exists. P.C. Mohanan confirmed it. Releasing the data now, six years after the fact, would do two things: provide researchers with a data point that fills a crucial gap in understanding the distributional effects of demonetisation and GST, and establish a precedent that suppression is not permanent.
Further Reading
Primary data and methodology
HCES 2023-24 Press Note (MoSPI, December 2024) — the primary official release; the fact sheet format buries distributional detail.
Canberra Group Handbook on Household Income Statistics, Second Edition (UNECE, 2011) — the international standard India participated in developing, but has never implemented.
India: Trends in Poverty, 2011-12 to 2022-23 (World Bank, May 2025) — the most detailed analysis of the new HCES data with explicit comparability caveats.
On what we can estimate despite the vacuum
Income and Wealth Inequality in India, 1922-2023: The Rise of the Billionaire Raj (Bharti, Chancel, Piketty, Somanchi, WIL Working Paper, March 2024) — the most comprehensive income distribution estimates available for India; the primary source for all WIL figures in this article.
Towards Tax Justice and Wealth Redistribution in India (WIL Issue Brief 2024-01) — the policy implications of the Bharti et al. estimates.
All the Reasons Why the World Bank's Claims on Falling Inequality Are Wrong, The Wire — systematic critique of the consumption Gini as an inequality measure.
On the suppression pattern
Interview: Former Statistics Body Chief on Government Interference and Suppression of Jobs Data, Scroll.in — P.C. Mohanan's account of the PLFS suppression.
India's Statistical System: Past, Present, Future (Carnegie Endowment, 2023) — the most systematic external assessment of institutional decline.
The Household Consumption Expenditure Survey 2022-23, The India Forum — the most rigorous methodological critique of the new HCES comparability problem.
On the 2026 income survey
Household Income Survey to Bridge India's Data Gap, Policy Circle — on the survey announcement, design, and institutional context.
From Policy Grounds
Stock and Flow: Why Modi's Welfare State Cannot Touch Wealth — the companion piece to this article, examining how the political economy of welfare programmes depends on the data vacuum described here.
The Budget That Parliament Voted On Has Already Expired — on the GDP rebase and what a smaller nominal economy means for social spending ratios; directly relevant to how measurement choices interact with fiscal accountability.
If the arguments in this article interest you, the data behind them is openly available at someperspective.info — an independent research project tracking India's economy, inequality, and democratic institutions from 2004 to 2026, with interactive charts, downloadable datasets, and three original indices that quantify what is usually only described.
Varna Sri Raman is a development economist and writes at policygrounds.press.


Write a comment ...